
How to Read Your CGM Data: A Beginner's Guide
- mds diabetes
- Jun 19
- 3 min read

If you've just started using a Continuous Glucose Monitor, all those numbers, graphs, and arrows can feel a little overwhelming at first. Don't worry — you're not alone! This beginner-friendly CGM data reading guide will walk you through everything you need to know to understand your readings and feel more in control of your diabetes journey.
What Is a CGM and What Does It Measure?
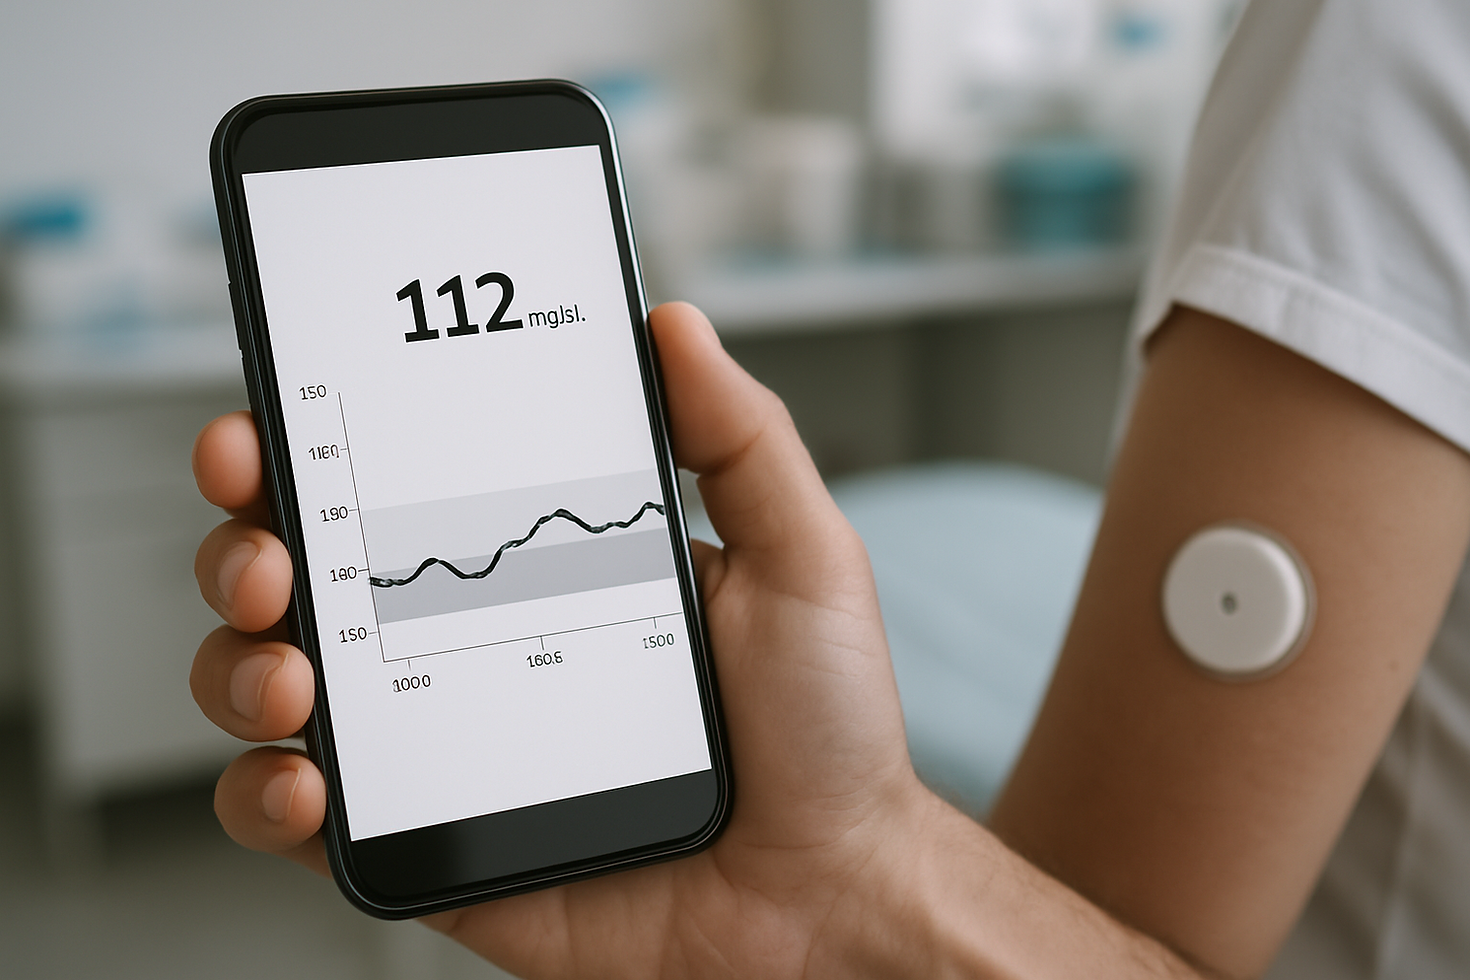
A Continuous Glucose Monitor (CGM) is a small wearable device that tracks your blood sugar levels in real time, usually every 1 to 5 minutes. Instead of a single snapshot like a fingerstick test, it gives you a full picture of how your glucose moves throughout the day and night.
Measures glucose in the fluid under your skin (interstitial fluid)
Sends readings wirelessly to a smartphone app or receiver
Tracks trends over hours, days, and weeks
Alerts you when your blood sugar goes too high or too low
Understanding Your Glucose Numbers
Your CGM displays your current glucose level as a number, typically measured in mg/dL. Most healthcare providers recommend a target range between 70 and 180 mg/dL for many adults with diabetes, but your personal targets may differ — always check with your care team.
Below 70 mg/dL: Low blood sugar (hypoglycemia) — take action quickly
70–180 mg/dL: General target range for many people with diabetes
Above 180 mg/dL: High blood sugar (hyperglycemia) — may need attention
Your doctor will help you set your own personalized target range
How to Read the Trend Arrows on Your CGM
Those little arrows next to your glucose number are one of the most useful features of your CGM. They show you the direction and speed your blood sugar is moving, not just where it is right now.
Single arrow pointing up: Rising moderately (about 1–2 mg/dL per minute)
Double arrows pointing up: Rising rapidly — consider taking action
Single arrow pointing down: Falling moderately
Double arrows pointing down: Falling rapidly — watch for low blood sugar
Flat arrow: Blood sugar is steady and stable
What Is Time in Range and Why Does It Matter?
Time in Range (TIR) is a key metric shown in most CGM apps — it tells you what percentage of the day your blood sugar stayed within your target range. Many diabetes care experts consider TIR one of the most meaningful ways to measure how well your management plan is working.
Reading Your CGM Graphs and Reports
Your CGM app generates easy-to-read graphs that show your glucose levels as a colorful line over time. Learning to spot patterns — like blood sugar spikes after meals or dips overnight — helps you and your care team make smarter decisions together.
Look for consistent highs after specific meals (possible diet adjustments needed)
Notice overnight lows that could signal a medication or snack timing change
Use the daily overlay graph to spot recurring patterns across multiple days
Share your CGM reports with your doctor at every appointment
Tips for Getting the Most Accurate CGM Readings
CGMs are incredibly accurate, but a few simple habits can help make your readings even more reliable. Small things like proper sensor placement and staying hydrated can make a real difference in your data quality.
Always insert your sensor in recommended body areas (arm, abdomen, etc.)
Calibrate with a fingerstick test if your CGM or doctor requires it
Avoid placing sensors near scar tissue or areas with heavy movement
Stay well-hydrated — dehydration can affect sensor accuracy
Replace your sensor on schedule to maintain consistent performance
Shop Diabetes Supplies at MDS Diabetes
Ready to get the most out of your CGM journey? MDS Diabetes carries a wide selection of CGM supplies, sensors, and diabetes management essentials to keep you stocked and confident every day. Visit us at mdsdiabetes.com or give our friendly team a call at (877) 861-3571 — we're here to help you thrive!
Comments